|
Introduction
This white paper provides a history of Walmart’s distribution center network in the United States to the current day. The intent is to provide a detailed look at the evolution of Walmart’s U.S. logistics infrastructure since the time when the company's first formal warehouse operation was opened in 1970.
Walmart’s current U.S. retail store and distribution network is massive at 783 Million and 151 Million square feet respectively for a total of 934 Million square feet. To put things into perspective, the Central Park is 39 Million square fee so this is the equivalent of almost 24 Central Parks!
We have taken the time to research the opening dates and square footage of each distribution center for the purpose of compiling the evolution of the Walmart’s distribution network. Now you may be wondering why anyone would undertake to research this information. The answer is quite simply that we are supply chain people and we are interested in understanding how the world's most successful companies strategically distribute goods to market. In the case of Walmart, the company's multiple supply chains have evolved over the years so it is important to educate logistics professionals with an understanding of this evolution.
We also undertook to research Walmart’s distribution network as a means to measure several key ratios that compare retail store square footage to distribution center square footage. To our knowledge, no one has analyzed this information in the past so we thought that this information may be useful for people seeking to understand the company's supporting distribution infrastructure relative to its retail store network. It was a painstaking effort to review the entire history of Walmart’s public financial statements and 10-K filings but this enabled us to develop the statistics and charts below that describe the ratio of net sales revenue and cost of goods per square footage of distribution space since 1970.
We have organized Walmart’s distribution centers by Facility Type, State, and City based on the following main facility types:
- Regional Distribution Centers (RDCs)
- Food Distribution Centers
- Fashion Distribution Centers
- E-Commerce Fulfillment Centers
- Sam’s Club “Dark Store” E-Commerce Fulfillment Centers
- Specialty Distribution Centers (Export, Optical Labs, Pharmacy, Returns Processing, Tires, Print and Mail)
- Import / Redistribution Centers
- Center Point Distribution Centers
- Sam’s Club Distribution Centers
- Closed/Cancelled Walmart Distribution Centers.
As a side note, if you compare our statistics to Walmart’s public financial statements our information indicates a larger network because we include 3PL facilities that are dedicated to Walmart but not operated to Walmart. We also include several converted Sam’s Club retail stores that have been converted to “dark stores” for e-commerce order fulfillment. These dark stores are technically not distribution centers but we include them because they are involved in the e-commerce order fulfillment network. Lastly, we may be missing a few e-commerce fulfillment facilities so if you wish to update our information please do not hesitate to send us feedback.
It is important to note that approximately 81% of the merchandise sold from Walmart stores is shipped through Walmart’s distribution center network. Similarly, 64% of the non-fuel merchandise sold from Sam’s Club stores is shipped through Sam’s Club distribution center network. The balance of sales is serviced through the DSD distribution channel (.i.e. direct store delivery refers to when the manufacturer/supplier delivers goods directly to the store. thus bypassing the retailer distribution network. This channel is often used for food commodities such as snacks, beverages, beer, fresh bread, milk, etc. For more information on DSD refer to this white paper).
Please note that in future we will no longer be updating this information online due to the high rates of plagiarism of this content. People seem to think that stealing digital content is fine but we remain the only accurate source of this data and we have invested significantly to support this project for over 16 years. If there is an interest in obtaining current information available in XLSX format then please contact us and we can provide details regarding the commercial terms. You can reach us by email here.
Walmart U.S. Distribution Center Network Summary
The table below provides a summary of Walmart’s distribution center network in the United States as at 2025 Q1.

Walmart Regional General Merchandise Distribution Center (GMDC or RDC) Network in the United States
Walmart currently operates a national network regional general merchandise distribution centers in the United States totaling approximately 50 Million square feet. These massive facilities are typically within the range of 1.0 - 1.6 Million square feet at 35’ clear stacking height. The average distribution center employs over 1,000 warehouse associates. The average one-way travel distance to the stores is approximately 124 Miles.
Walmart’s regional GMDC facilities generally do not vary significantly in design from site to site as explained below. In general, Walmart owns and operates these facilities which serve as the strategic backbone for the company's hard lines general merchandise distribution network. The narrower rectangular portion of the facility is typically designed for a mechanized conveyor system that can be anywhere from 10 - 20 miles in total length. Conveyors are used to flow through cases of merchandise that are already allocated to store orders at the time of receiving. Each full case has a Walmart-compliant label such that the conveyance system can sort the merchandise to the correct shipping dock door assigned to a store (i.e. “door per store” is the industry term that is used for this). A typical facility may have between 90 -170 stores being serviced whereby outbound trailers are staged at dock doors throughout a shipping shift until they are cubed or weighed out. The narrower rectangular portion of the facility is typically designed for a mechanized conveyor system that can be anywhere from 10 - 20 miles in total length. Conveyors are used to flow through cases of merchandise that are already allocated to store orders at the time of receiving. Each full case has a Walmart-compliant label such that the conveyance system can sort the merchandise to the correct shipping dock door assigned to a store (i.e. “door per store” is the industry term that is used for this). A typical facility may have between 90 -170 stores being serviced whereby outbound trailers are staged at dock doors throughout a shipping shift until they are cubed or weighed out.
Since not all merchandise is conveyable and not all merchandise can be pre-allocated, there is also a conventional full case and split case section of the facility. This is a racked section of the warehouse within the larger rectangular portion of the complex. On this side of the complex, pallets are received on one side of the building and then putaway into storage racks. Pallets are then replenished to pick locations where merchandise is subsequently picked and either deposited to conveyor belts or to electric double pallet jacks. Full case and split case picking modules can be designed with picking to conveyors up to 3 - 4 vertical levels high. In general, bar-coded label picking is used for full case picking and put to light / pick to light is used for split case merchandise stored in case flow racks as a means to improve speed and accuracy.
A portion of the GMDC complex is also used for full pallet cross docking operations. Faster moving SKUs are moved through the facility in pallet unit loads from receiving docks across to shipping docks positioned on the opposite side of the complex. Walmart controls a much larger percentage of its inbound freight as compared to most retailers, hence floor space is also used for the purpose of moving inbound backhaul merchandise through the facility to ship to other distribution centers within the network; or to serve as a consolidation point for remixing purposes.
In the past, Walmart’s General Merchandise distribution centers were primarily established to distribute hard lines (i.e. non-food) commodities including electronics, health and beauty aids, sporting goods and toys, appliances, etc. Similarly, the company's grocery distribution network was primarily established to distribute dry grocery, fresh dairy/deli/meat/produce and frozen food commodities. Starting around 2006, the company began to blur the lines between the role of the general merchandise distribution network and the role of dry grocery distribution network. In effect, roughly 4,000 of the fastest moving dry grocery and general merchandise products were mixed (i.e. combined) so that these fastest velocity items can be distributed from all eligible General Merchandise and Grocery distribution centers. This remixing concept is a network strategy that is often referred to as a fast/slow distribution strategy whereby the fastest cube-movement products are positioned closer to the retail stores and slower moving products are stocked at fewer distribution points that are further away from demand points. Why does this strategy make perfect sense? Quite simply because the fastest-moving products generate the most truckload volume and therefore miles of travel to support the stores. These items move so quickly that their inventory turns are extremely fast, hence the inventory penalty associated with stocking these items at twice as many distribution centers is relatively low. On the other hand, these items generate the majority of cube movement therefore stocking them closer to the stores takes out significant over the road transportation miles. As well, the most important items are generally the products that move the fastest therefore the stores receive improved service levels for these items because they are stocked closer to the store. This is consistent with Walmart’s on-going efforts to reduce out of stocks at retail, to take cost out of the supply chain and to support its green initiatives. In other words, the remixing concept is a winner across all fronts.
Similarly, as the e-commerce channel began to become a larger sales channel starting around 2018, the company began changing the role of the RDCs so that some of these facilities also manage the fulfillment of online consumer orders in addition to retail store orders. This is particularly true for products that are being shipped to the retail stores in the same unit of measure that is being ordered by the consumer (i.e. the vendor carton contains one retail unit). In the list below we indicate which if the RDCs serve a dual e-commerce role (Note that the 2nd DC number is the DC number assigned to the e-commerce fulfillment center).
Below is a list of Walmart’s Regional General Merchandise Distribution Centers in the United States.

Walmart Food Distribution Center Network in the United States
Walmart currently operates a national network of food distribution centers in the United States exceeding 36.0 Million square feet. The typical full-line food distribution center is in the range of 850,000 - 1.0 Million square feet with 750 - 800 warehouse associates. The average one-way travel distance to the stores is approximately 134 miles.
Walmart’s Full-Line Grocery distribution centers are generally L-shaped facilities with a square-shaped Dry Grocery building forming one side of the L-shaped complex, and a long rectangular Perishables building forming the other side of the complex, The Dry Grocery buildings typically have 3 sides dedicated to dock doors to enable maximum throu ghput and crossdock capacity while the Perishables buildings having receiving and shipping docks on the opposite sides of the complex. Walmart owns and operates these facilities which serve as the backbone of the company's food distribution network including Dry Grocery, Dairy, Deli Meats, Fresh Meat, Produce and Frozen Food. Walmart was an early adopter of Vocollect’s voice picking technology to improve the speed and accuracy of full case picking operations within their grocery distribution operations. ghput and crossdock capacity while the Perishables buildings having receiving and shipping docks on the opposite sides of the complex. Walmart owns and operates these facilities which serve as the backbone of the company's food distribution network including Dry Grocery, Dairy, Deli Meats, Fresh Meat, Produce and Frozen Food. Walmart was an early adopter of Vocollect’s voice picking technology to improve the speed and accuracy of full case picking operations within their grocery distribution operations.
At least 17 of Walmart’s Perishables distribution centers service both Walmart and Sam’s Club stores. Over time, the Walmart and Sam’s Club food distribution networks have converged to capture synergies for logistics cost reduction purposes, particularly on the perishables side of the business. This is clearly logical since perishables usually makes up 50% of the outbound truckloads shipped to the store from a full-line grocery distribution center.
Lastly, Walmart has implemented automated material handling systems in several of their Perishables distribution centers. In some cases they have worked with Swisslog as their integration partner. In the Swisslog facilities Walmart has deployed high rise stacker cranes (ASRS) which automatically store incoming pallets and then replenish multi-level picking modules where conventional voice-directed picking to double pallet jack or pick to belt is performed. Our research indicates that six automated distribution centers exist in the network as identified in the table below. One of the challenges that Walmart faces is that the company is such an efficient low-cost operator that cost justifying extensive capital investments into automated material handling systems is difficult, hence the majority of the facilities remain as conventional distribution operations.
More recently Walmart has invested into Witron automation to fully automate full case distribution in a couple of perishables distribution centers where significant capital investments have been justified due to the high cost of land and labor.
Below is a list of Walmart’s food distribution centers in the United States.

Walmart E-Commerce Fulfillment Center Network in the United States
Walmart’s U.S. e-commerce fulfillment center network requires some explanation because it is complicated by the fact that there are multiple types of e-commerce operations that are active. The company's e-commerce distribution centers are actually more extensive than we indicate in the table below because the table below only identifies the distribution centers that are 100% dedicated to e-commerce order fulfillment. In addition to these dedicated e-commerce facilities, Walmart also fulfills e-commerce orders from 8 regional distribution centers; 2 fashion distribution centers; 6 Sam’s Club dark stores that were converted from retail stores; and 3 import distribution centers. Thus all-told the company currently fulfills online orders from 45 facilities of which 25 are strictly dedicated to e-commerce.
Walmart opened their first dedicated e-commerce fulfillment center in Fort Worth in 2013. The company has since been investing heavily in their fulfillment network which is supplemented by in-store order fulfillment capabilities. The company is also in the process of converting multiple Sam's Club stores into e-Commerce metro-market facilities which we list in a separate table after the table below
Below is a list of Walmart’s “dedicated” e-commerce fulfillment centers in the United States.

Sam's Club E-Commerce Dark Store Network in the United States
Sam's Club has converted several retail stores into dark stores to serve as small metropolitan e-commerce fulfillment centers. An incomplete A list of active known dark stores appears in the table below.

Walmart Fashion Distribution Center Network in the United States
Walmart currently operates 7 Fashion distribution centers in the United States totaling approximately 8.0 Million square feet. These massive distribution centers are within the range of 640,000 - 1.6 Million square feet and employ around 700+ warehouse associates.
It is hard to believe that Walmart’s first fashion distribution center was launched back in May, 1972. Back then, it was a 22,000 square foot section of Walmart DC#6000 in Bentonville, AR allocated to ticketing and distributing wearables. This was actually Walmart’s first warehouse which handled both soft lines and hard lines merchandise. This facility was expanded multiple times to 236,800 square feet and in 1986 it was eventually converted into head office space.
Today, Walmart’s Fashion distribution centers are generally large rectangular-shaped facilities that are highly mechanized with conveyance systems designed to service upwards of 1,000 stores.
Below is a list of Walmart’s fashion and footwear distribution centers in the United States.

The Walmart Specialty Distribution Center Network in the United States
In addition to the distribution networks documented above, Walmart also operates a number of specialty distribution centers that service different commodities which include:
- 1 Export Distribution Center (ed. note - Walmart actually considers this to be part of their international distribution center network. We include this facility in our list because it is based in the U.S.)
- 1 Walmart/Sam’s Club Distribution Center in a campus in Puerto Rico that is now considered to be part of the U.S.network
- 3 Optical Laboratory Plants
- 4 Pharmacy Distribution Centers
- 1 Print and Mail Distribution Center and and 1 STaR North IT Distribution Center
- 5 Returns Centers; 6 Returns Consolidation Centers; 7 Used Asset Centers; 1 Material Consolidation Center; & 2 Electronics Refurbishment Centers
- 1 Tire Distribution Center
- 1 Appliance Distribution Center
Below is a list of Walmart Specialty distribution centers for which we have records.

Walmart Import Distribution Center Network in the United States
Walmart currently operates Import distribution center buildings in port locations around the United States totaling 19 Million square feet. There are plans underway to add 2 new import centers totaling 4.8 Million square feet. These massive facilities are positioned close to major U.S. p orts located in Long Beach, Houston, Savannah, Norfolk and Chicago. Each import center receives containers of merchandise from Asia Pacific (and the rest of the world) and then redistributes this merchandise to the company’s regional general merchandise and grocery distribution centers within its region. Thus these facilities are not designed to ship directly to stores. orts located in Long Beach, Houston, Savannah, Norfolk and Chicago. Each import center receives containers of merchandise from Asia Pacific (and the rest of the world) and then redistributes this merchandise to the company’s regional general merchandise and grocery distribution centers within its region. Thus these facilities are not designed to ship directly to stores.
For most of these facilities, Walmart’s labor strategy has been to outsource these operations to third party logistics providers that use staffing agencies to recruit warehouse associates. This labor strategy is not unique to Walmart and this approach is typically used to establish an arm's length relationship with the labor force. Unfortunately, the intense pressure to drive operating expenses down often places the third party logistics provider in a difficult position where they have no choice but to place increasing demands on the labor force to obtain increased productivity at a reduced operating expense. Ultimately this pressure can backfire resulting in labor-related issues that generate negative publicity for the retailer. This was exactly the case for Walmart in 2012 at two of its import distribution center campuses operated by Schneider Logistics in Mira Loma, CA and Elwood, IL.
Lastly, over the years Walmart has vacated several import distribution center buildings in Mira Loma, CA and Savannah, GA. Below is a list of import distribution centers in the United States.

Walmart Center Point Distribution Centers
Walmart has developed a dedicated distribution network to consolidate inbound merchandise from domestic suppliers for shipment to their distribution centers. The company refers to these facilities as Center Point distribution centers (CP) and they are utilized to consolidate inbound loads of merchandise with the goal to minimize the net landed cost of goods into their distribution network. Center Point distribution centers are similar in shape and size to cross dock / LTL terminals in that they tend to be long “skinny” buildings with many dock doors on either side of the building (the exception to this rule being the facilities that are utilized for public cold storage applications). These facilities are strategically located around the country with the objectives being to minimize inbound transportation costs primarily for Less than truckload (LTL) loads. 
Rather than suppliers sending small shipments directly to Walmart’s many distribution centers around the country, Walmart reduces inbound freight costs by having suppliers transport their LTL loads into the nearest CP. The CP then consolidates all merchandise going to the same distribution center with the goal to achieve a full truckload inbound to every DC. Trucks are dispatched from the CP to the distribution center when a full truck load is achieved, or when a time window constraint has elapsed. In short, the consolidation of inbound LTL loads at strategic locations within the Walmart network enables the elimination of millions of inbound travel miles to replenish inventory throughout the Walmart distribution network. This is an important concept that can be leveraged by any national retailer seeking to reduce the net landed cost of goods within their supply chain by taking greater control over their inbound freight.
Walmart’s Center Point distribution network consists of the dedicated facilities listed below which are mainly cross dock terminal buildings, most of which are operated by third party logistics firms. In addition to the facilities listed below, Center Point facilities are also attached to existing Walmart DC locations such as Desoto, TX; Laurens, SC; Seymour, IN; Grove City, OH; Ottawa, KS; Saint James, MO, and 2 other sites. Below is a list of the dedicated Walmart Center Point distribution centers.

Sam’s Club Distribution Center Network in the United States
Sam’s Club currently operates a national network of cross dock facilities across the United States. The majority of these operations are small crossdock facilities (similar to LTL truck terminals) that range between 40,000 - 100,000 square feet in size. The majority, but not all, of these facilities are operated by 3PL companies.
Sam’s crossdock facilities are basically long rectangular shed-like buildings with many dock doors on either side of the facility. Full pallets are received on one side of the building and then a forklift driver crossdocks the pallet directly to a stage d trailer assigned to a store/shipping door on the other side of the building. In general, full pallets are handled within these cross dock operations. A couple of the Sam’s Club distribution centers are set up for high variety full case and split case picking but the vast majority of volume is shipped out as full pallet unit loads via cross dock terminal facilities. Approximately 64% of the non-fuel merchandise sold at a Sam’s Club store is serviced through the company’s distribution network with the balance being delivered directly to the store so 36% of the goods bypass the Walmart network altogether. d trailer assigned to a store/shipping door on the other side of the building. In general, full pallets are handled within these cross dock operations. A couple of the Sam’s Club distribution centers are set up for high variety full case and split case picking but the vast majority of volume is shipped out as full pallet unit loads via cross dock terminal facilities. Approximately 64% of the non-fuel merchandise sold at a Sam’s Club store is serviced through the company’s distribution network with the balance being delivered directly to the store so 36% of the goods bypass the Walmart network altogether.
It is not clear why Sam’s Club outsources the majority of its crossdock operations to multiple 3PL companies. Sam’s Club has a very demanding benchmarking scorecard system to measure the performance of its 3PL warehouse and transportation service providers. Each year awards are given to the highest performing suppliers based on their performance. This creates a highly competitive environment which ultimately maximizes the quality of service and productivity rates achieved across the network. Our conjecture is that Walmart outsources most crossdock operations to 3PLs as a means of keeping its distribution network flexible to the ever expanding store network that needs to be supported. As such, the crossdock network can be adjusted with greater flexibility than if the company owned and operated all of these facilities.
Below is a list of dedicated Sam’s Club cross dock facilities

Walmart Manufacturing Facilities
Walmart is increasing its vertical integration through the build-out of food manufacturing facilities.

Walmart Distribution Centers That Have Been Vacated or Projects That Have Been Canceled
Since Walmart introduced its first distribution center in 1970, Walmart has vacated a number of distribution centers. A list of the facility closures and project cancellations that we are aware of is below. There have likely been others which are off the record.

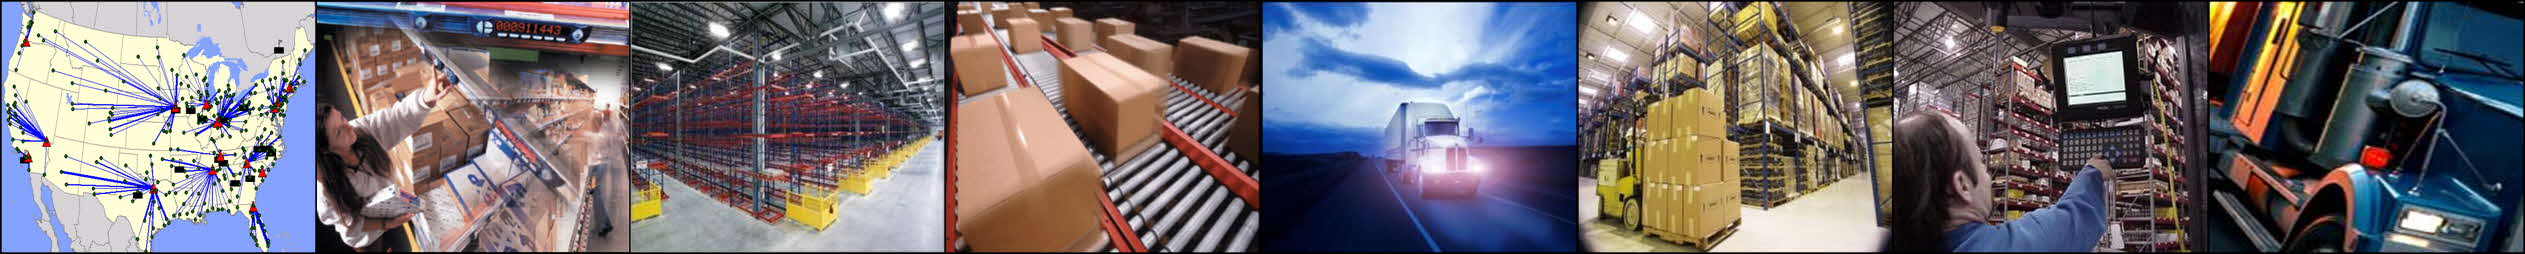
Maps
Walmart’s U.S. distribution network is depicted by supply chain in the maps below.


Distribution Center Growth Curves
Since 1970, Walmart’s growth in distribution center space within the United States is depicted in the graphs below. During the 1990’s, Walmart quadrupled its regional general merchandise distribution center square footage by growing from 7.3 Million sq. ft. to 29.6 Million sq. ft. It was without a doubt the logistics story of the decade.
Between 1996 - 2006, Walmart exploded its supercenter concept and the company’s food distribution network rapidly expanded proportionately to support the distribution of grocery and perishables merchandise. During this time, Walmart’s grocery and perishables distribution center square feet grew from 5 DCs totaling 4.2 Million square feet to 39 DCs totaling 31.5 Million square feet - an astonishing 750% increase! It was an unprecedented assault on an otherwise complacent industry characterized by razor thin profit margins and low levels of innovation. During this ten-year period, many well known regional supermarket chains went out of business due to this sizable loss of market share. Walmart’s incredible growth in the grocery industry was indeed the logistics story of the 2000’s.


Key Ratios
Walmart publishes annual statements and 10-k forms that provide insight into the company’s revenues, profits and cost of goods sold by segment (Walmart USA, Sam’s Club USA, Walmart International). The company has also published its retail square footage information since 1969. As well, the % of sales generated from products distributed through the company’s distribution network versus the DSD channel is also published. Thus we can analyze several interesting questions to provide a unique perspective that may be meaningful.
- What ratio of retail square footage to distribution center square footage does a company like Walmart have in the U.S.? How has this changed over time?
- What ratio of net sales revenue to distribution center square footage does a company like Walmart have in the U.S.? What about sales revenue through the distribution center? What about cost of goods through the distribution center? How has this changed over time?
To be clear, not all of the data to answer such questions is publicly available, however through the process of extrapolation we can develop charts and statistics that are directionally correct. This process is described below for those that may be interested.
- Walmart and Sam’s Club retail square footage is information that is readily available thus we can chart this information against distribution square footage for the U.S. market.
- Walmart and Sam’s Club net Sales information is readily available thus we can chart this information against distribution square footage for the U.S. market.
- Information on the % of net sales sold through the distribution network is also available for both Walmart and Sam's Club hence we can identify the net sales through the DC network as a more meaningful ratio because it excludes DSD sales (i.e. sales through the direct store delivery channel).
- Information on the cost of sales (cost of goods sold) is more challenging because this number is a consolidated figure for all business divisions including international. Thus the International cost of goods needs to be removed to derive the cost of goods sold through the U.S. so we used the International sales revenue as a % to total sales to pull out cost of goods associated with international markets. We then determined the U.S. cost of goods sold for Walmart and for Sam’s Club by again using net sales as a percent to total sales for each division. We then applied the % of goods sold through the distribution network to the cost of sales figures separately for Walmart and for Sam’s Club because the business models are very different. Walmart tends to ship 80-85% of its cost of goods through its distribution network whereas Sam’s Club tends to ship between 60-65% through its network. Using this extrapolation technique, we came up with an estimated total cost of goods sold through the company’s U.S. distribution network. It is definitely not perfect information but the charts should be directionally correct.
- Keep in mind that Walmart self-distributes partial-line pharmaceuticals products and the dollar value of pharmaceuticals is extremely high relative to the square footage of distribution space needed to support this business. For this reason, Walmart’s cost of goods sold per square footage of distribution center space will likely be much higher as compared to similar retailers that do not self-distribute pharmaceuticals.
- Also keep in mind that Sam’s Club sales revenue relative to distribution center square feet is much higher than most retailers because most of the non-DSD merchandise passes through smaller crossdock facilities in pallet quantities. It is not possible to break out the Sam’s Club DC network from the Walmart DC network because these networks are converged meaning that many of Walmart’s facilities also serve Sam’s Club stores, particularly on the food side of the business. This distortion causes a higher sales figure per square footage of distribution center space as compared to a retailer that does not operate with a club store concept!
- Lastly, it is important to keep in mind that all of the warehouse space that a company requires can never be captured throughout its history for things like 3rd party facilities that come and go, the use of outside storage warehouses or trailers to hold excess inventory, etc. Suffice to say that recording the history of any company’s distribution center space is not a perfect science . Hopefully these issues do not change the results derived below.
Having said the above qualifying statements, below are several charts of key ratios that hopefully help to make sense of how Walmart has become more efficient over the years from a supply chain perspective.


Key Learnings- Interpreting the Analytics
What do the charts above tell us? As we mentioned in the qualifying statements, these results are not necessarily useful to benchmark against other retailers because they are highly dependent on the product lines being distributed and the retail store format being serviced. Sales of pharmaceuticals create extremely high revenues and require a small distribution footprint. Sales through the warehouse club format are high relative to the distribution center footprint because the goods are primarily cross-docked in pallet loads and there is a low labor/space requirement to move goods to market. What we can use the above charts for is to benchmark Walmart against itself over time. We have always advocated that most industry-wide benchmarking efforts provide meaningless results. The only benchmarking that matters is to measure one's own performance against oneself over time.
From our perspective, the following learnings can be derived from the above charts:
- The first chart depicts the number of retail square feet supported by distribution center square feet over time. We can see that this ratio has leveled out to about 6.2 over time. Now one may look at this curve and suppose that Walmart has actually become more inefficient because this ratio has declined over the years. It would be a grave mistake to draw this conclusion. Walmart is an industry leader at cutting costs - we all know this. What this chart helps to prove is that Walmart reduces the net landed cost of the product to the retail shelf by increasing the amount of control that the company has over distribution. Distribution centers are not evil cost centers that must be beaten into the ground to drive costs out. Distribution centers are absolutely critical to the success of the business and its ability to be price competitive.
- This is perhaps the most important learning of this research effort because all too often, retail executives fail to understand that distribution centers are at the heart of capturing market share and reducing the cost to serve the customer. Too many companies view the distribution center as en expense that must be minimized as opposed to a strategic weapon. The fact that Walmart has strategically increased its distribution space relative to its retail store space provides a clear signal to the market that they have found a winning formula. Increasing control over distribution as a means to success is the most powerful lesson that Walmart can teach the rest of the world. To further emphasize this point, the following quote is taken from Sam Walton's biography called Made in America - My Story, published in 1992:
- “Distribution and transportation have been so successful at Walmart because senior management views this part of the company as a competitive advantage, not as some afterthought or necessary evil. And they support it with capital investment. A lot of companies don't want to spend the money on distribution unless they have to. Ours spends because we continually demonstrate that it lowers our costs. This is a very important strategic point in understanding Walmart.” - Mr. Joe Hardin, executive vice president, logistics personnel (1986 - 1997).
- The second chart depicts Walmart’s net sales revenue to the U.S. market as a ratio to square footage of distribution center space within the U.S. From this chart we can see that this ratio has steadily increased over time which may in part be caused by inflation. The data suggests that this figure is currently running just below $2200 of Non-DSD net sales revenue per square foot of distribution space. The important thing is that this value has increased over time which means that more volume and/or higher dollar value merchandise is being moved through the DC network. This implies better margins and better leverage from existing assets - in other words better return on assets over time as far as distribution assets are concerned.
- The third chart depicts Walmart’s non-DSD cost of goods sold to the U.S. market relative to square footage of distribution center space within the U.S. From this chart we again see a steady increase over time, in part due to inflation, but mostly due to increased volume and higher value merchandise being distributed through the company’s network. The data suggests that this figure is currently running at around $1600 of non-DSD cost of goods sold per square foot of distribution space. As per the qualifying statements, this graph is generated through data extrapolation methods because cost of goods sold for non-DSD merchandise is not publicly reported therefore it may be subject to error.
Conclusions
Marc Wulfraat is the President of MWPVL International Inc. He can be reached by clicking here. MWPVL International provides supply chain / logistics network strategy consulting services. Our services include: distribution network strategy; distribution center design; material handling and automation design; supply chain technology consulting; product sourcing; 3PL Outsourcing; and purchasing; transportation consulting; and operational assessments.
Legal Disclaimer
MWPVL International Inc. does not represent Walmart nor do we have a business relationship with Walmart. This is a research paper for educational purposes only. The information assembled in this research paper is intended to provide the audience with intelligence on the subject of world class strategies for distribution networks. In preparing this material, MWPVL International Inc. has not disclosed any private or confidential company information. MWPVL International Inc. has made every effort to ensure that the information contained within this white paper is as accurate and as up to date as possible. However, it is important to note that distribution networks change over time and for this reason there is a possibility that information contained within this paper may be out of date or inaccurate. If you wish to submit any information to improve the quality of this white paper, please be sure to send us some feedback.

|